
To the procrastinators amongst us, the early 2000s provided just about all the distraction we could ask for. From peak Britney, cargo pants, flip phones, something called MySpace and eventually Facebook.
None of which compared to the ultimate procrastination companion, Microsoft’s Solitaire.
Not only did it provide a welcome escape from whatever we were supposed to be doing, but on the odd occasion you completed the game, the victory screen resembled what I believe most newcomer’s perception of reporting and analytics within inbound marketing looks like.

In 2019, platforms like HubSpot provide heaps of data, sources and metrics that can easily leave you wondering where to begin, and how to make sense of it all.
The truth, however, is that sifting through all the ‘data clutter’ is rather simple once you know what you’re looking for.
So which metrics matter most?
It’s important to remember that in most cases, inbound marketing is more of a marathon than a sprint.
For agencies or businesses who’ve passed the halfway mark of their marathon and are familiar with the ins and outs of content and all of the inbound fundamentals, you’re likely to be focused on more sophisticated metrics.
Deep data sets that track multiple levels of performance and audience segmentation should be high on the list of importance in every report.
Today’s post, however, focuses on those at the starting line.
Before worrying about conversion paths and optimising specific persona user journey’s, we need to understand what sort of website activity an inbound marketing campaign is generating, and who exactly it’s attracting to the site.
So let’s unpack the two most important metrics at the start of any campaign...
Website activity
The obvious place to start is, of course, your website. Understanding how your website is being used and exactly who is using it forms the backbone of any digital marketing campaign.
Some initial metrics to focus on include:
Traffic.
Regardless of where you’re viewing your data, HubSpot, Google Analytics, Moz or any of the analytics platforms, keeping a close eye on how many visitors are reaching your website is essential.
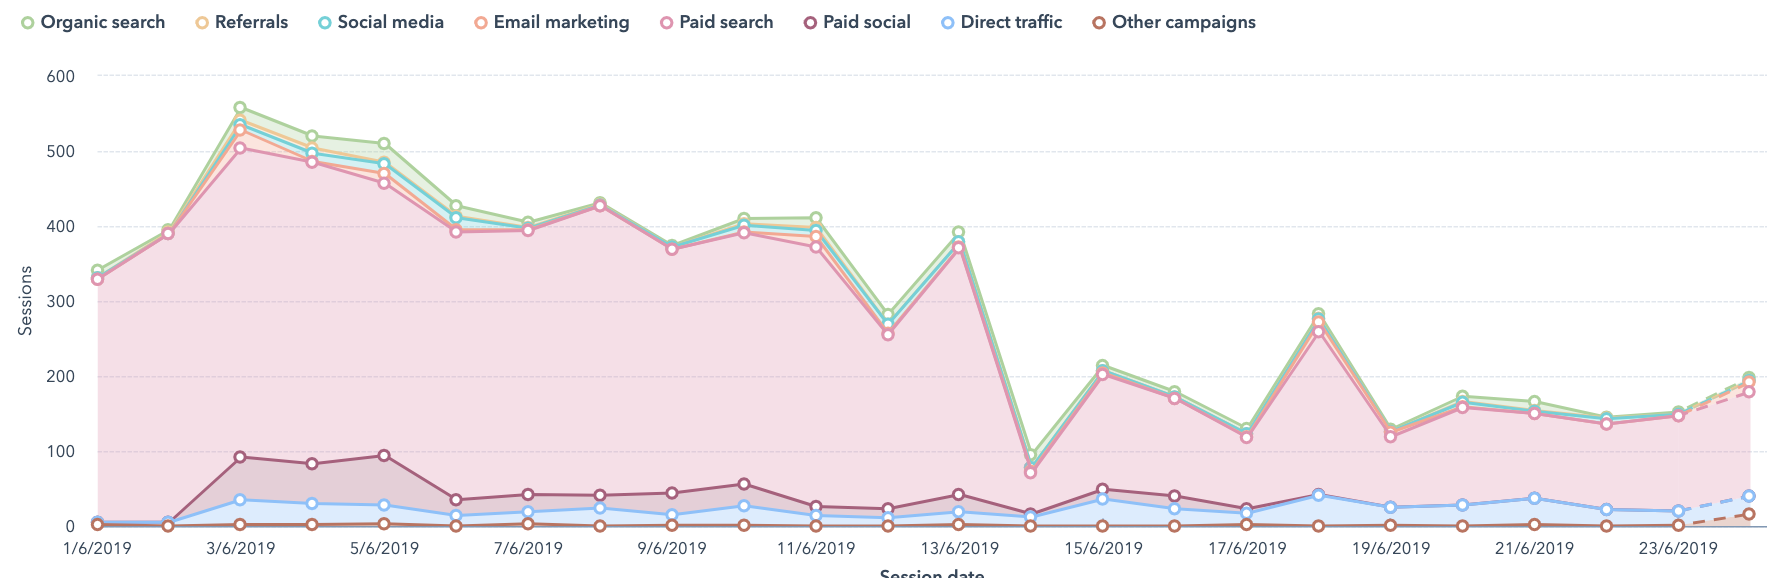
Website traffic feeds the top of every marketing funnel, so it’s important to understand exactly which channels are driving traffic to your site.
We tend to prefer using our HubSpot dashboards to analyse our traffic sources, as HubSpot functions as our CRM too. Meaning we can drill down and view the contact record of each new lead generated from organic search as an example.
The screenshot below highlights the trends of each traffic source for the past month:
Some of the other key metrics of your website that you should keep an eye on include:
Page Views.
Understanding which pages of your website are receiving the most traffic each month is important.
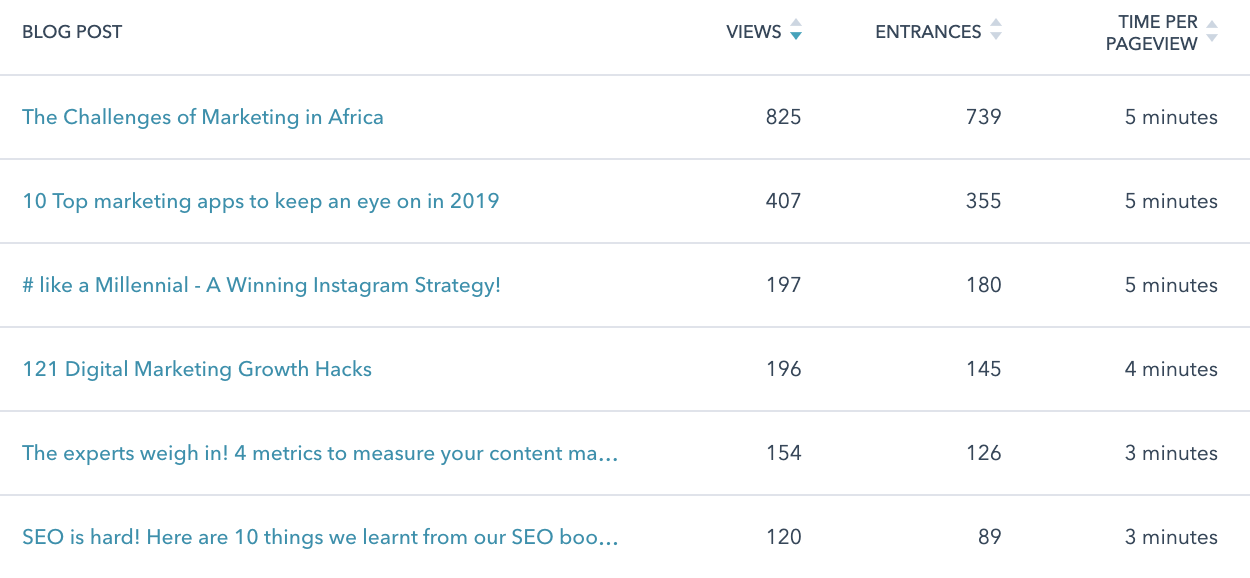
For example, we can see above which of our blogs has performed the best over the past month in HubSpot.
It not only shows how much time visitors are spending on each of your pages, but shows how far your visitors are diving into your site.
Knowing which pages are performing best highlights some key user behaviour that can help determine upcoming content calendars, site optimisations and more.
Visitors to leads conversion.
Having lots of traffic is great, but if not enough of your visitors are converting into leads it will pose a challenge.
Have a look at our most recent content campaign, a content marketing strategy template:
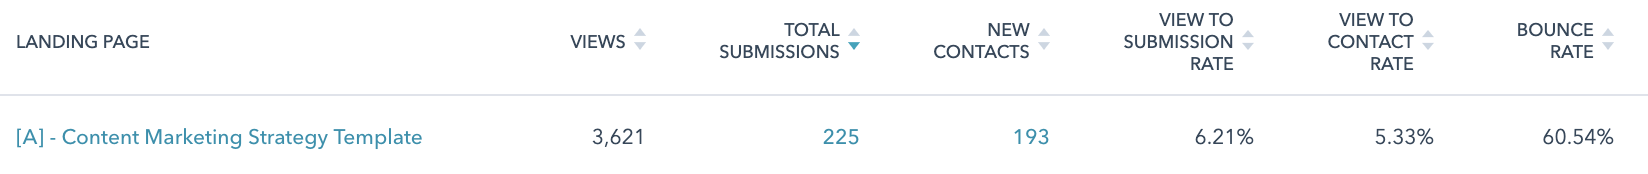
We now know that since its launch two weeks ago, the visitor to lead conversion rate is 6.21%.
Diving deeper into the campaign, and specifically, the sources of traffic that have visited the landing page will help us optimise specific conversion paths in the weeks and months ahead to maintain its performance.
Leads & contacts
Ask just about any marketing team what their primary role is and you’ll hear “generating leads”.
Not all leads are good leads though, it’s important to clarify in your reporting which leads are the right quality and which are not.
This can be done in several ways, the easy way is to qualify your leads based on whether or not they’re a fit to your buyer persona, ideal company size and industry or whether they’re a marketing qualified lead or sales qualified lead.
A metric that’s occasionally tricky to measure is the alignment between marketing and sales.
Having a number of leads convert at the top of your marketing funnel, but few moving down and converting at the bottom of your funnel is an indicator that sales and marketing may not be aligned in their approach and communication.
Where your leads are coming from.
Speaking of funnels, knowing how many leads you’ve generated is great, but understanding where they’ve come from and where and when they’re converting further down your funnel provides a lot of insight into their buyer’s journey.
A quick glimpse at the mix of lead sources our latest campaign generated below, highlights which of our channels perform best.
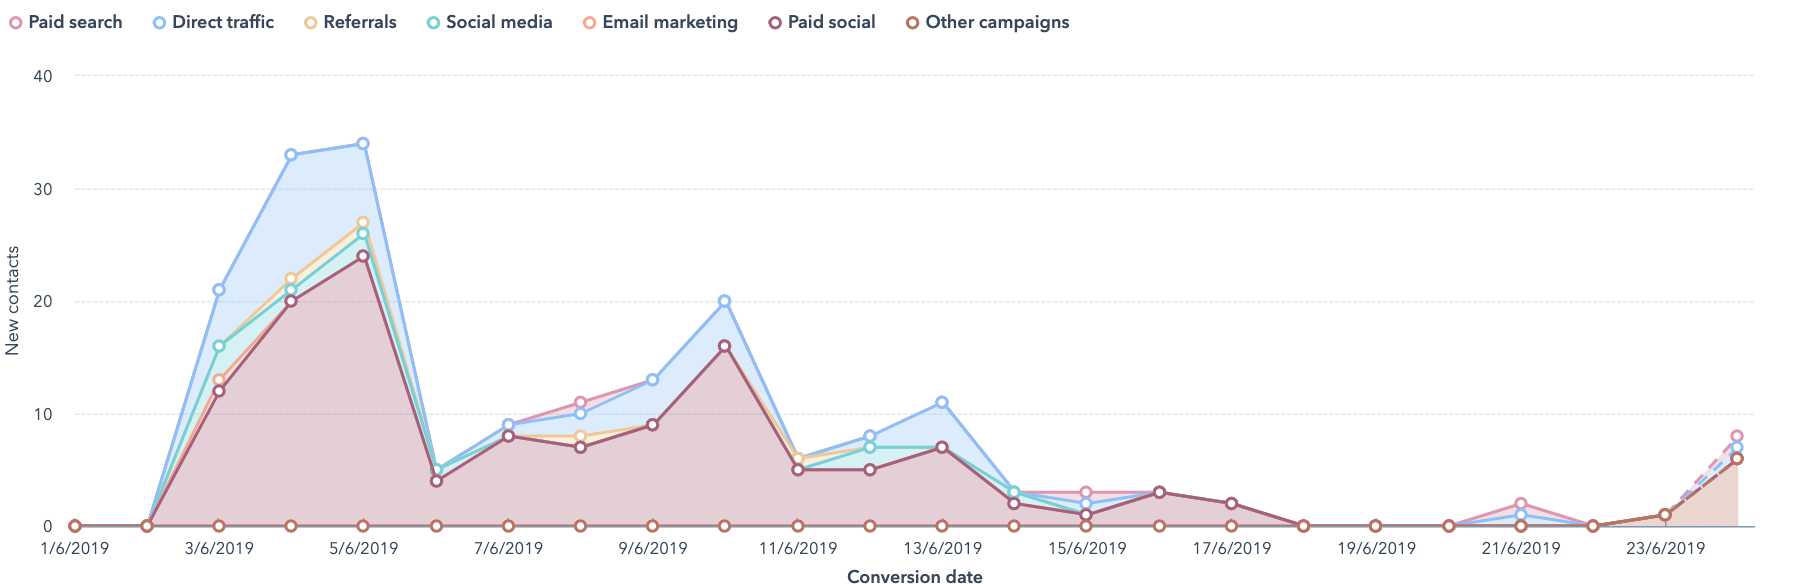
Further unpacking the data in HubSpot allows us to see exactly which pages each of those leads went on to view and each of the subsequent conversion paths they followed.
Cost per lead.
Another metric that’s important to keep an eye on, in the long run, is your cost per lead, per channel.
Traditionally understanding your cost per lead was the be all and end all of judging the success of an event, print campaign or direct mail campaign.
In inbound marketing, it’s just as important. Understanding which of your active channels (social media, paid search, etc) are providing the best ROI per campaign help determine future activities.
A look at one of our paid Facebook ads we ran in conjunction with our recent content marketing strategy template campaign shows us that our average cost per lead was just R21,24:
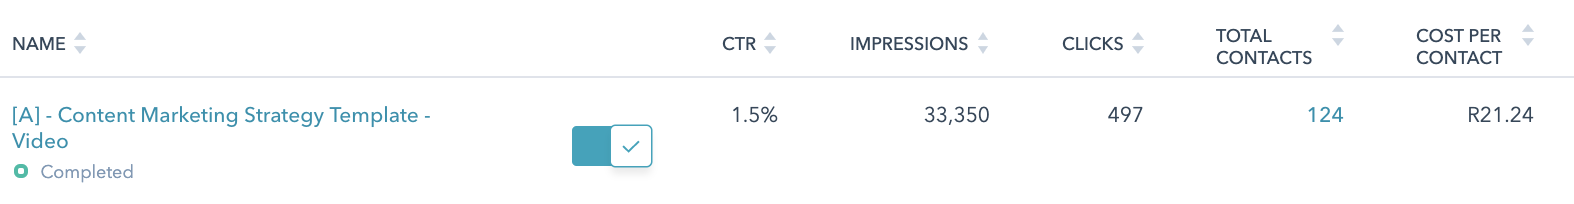
It helps us understand as an example, that the specific video format used in that ad set, along with the audience targeting and landing pages performed well and will undoubtedly influence future content campaigns and ad sets.
In truth, we’ve only just scratched the surface of important metrics to cover in a digital marketing campaign but it’s best to start simple and master the key metrics first, before diving deeper into the more complex analytics.
As my fellow procrastinators know only too well, the key to winning any game of solitaire is spotting the king and queen cards first.
After that, the rest of the cards always seem to fall into place.
We might have mentioned it above, but if you haven’t downloaded our free content marketing strategy template yet, what are you waiting for? You can get your copy below.