Instagram has recently announced that they have reached the unbelievable number of a billion subscribers, what’s amazing is that it doesn't look like there is anything that will curb this growth any time soon...
A billion is no small feat but even more exciting is that this opens up a whole new world of opportunity for you and your company to jump onto the Instagram bandwagon.
In theory, it is also potentially an opportunity for you to expose your brand to an unbelievable amount of people.
Your biggest challenge now may be trying to see where exactly in this billion subscribers your business will fit in?
But don’t stress…that’s why we're here.
Every great Instagram account was once a not so great Instagram account.
The most important thing about Instagram is to just get started.
What we want to do today is to show you how to use analytics to build your audience and make your account something to marvel at!
So without further ado, let’s dive in:
Posting on Instagram without taking data into consideration is like throwing spaghetti against the wall and hoping that something will stick...
Instagram analytics allow us to make the right decisions for both our accounts and for our audience.
Let’s start off by listing all the metrics available so that we can build a baseline understanding and make sure that we are all on the same page.
There are two levels of metrics that will provide you with valuable data that you will be able to glean insights from;
1st level metrics can easily be obtained from Instagram Insights which is their native analytics tool.
2nd level metrics require a little bit more work to calculate. To get these, you may need a calculator, an excel spreadsheet (don’t let this scare you as we will hold your hand through the whole process) or might be available to you from a paid Instagram analytics app.
Instagram Analytics 1st Level Metrics
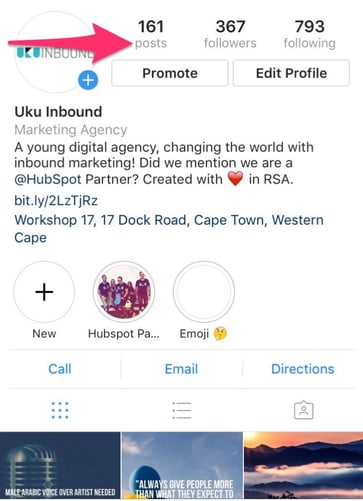
Follower Count: This is probably the metric that everyone considers first when they look at and Instagram profile, it's the number of people following your Instagram account.

Impressions: The total number of times all of your posts have been seen.
Reach: The number of unique accounts that saw any of your posts.
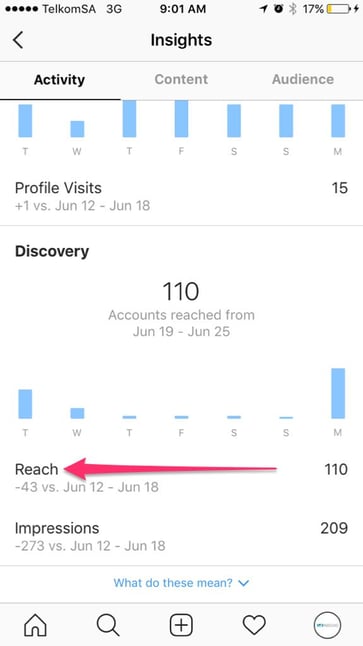
Bonus Tip: Often there is confusion between Impressions and Reach, your reach will always be lower than your impressions because reach is the number of unique accounts that saw your post and impressions is the number of times that your posts have been seen e.g. if one person looked at the same post 5 times, your reach is 1 and your impressions would be 5.
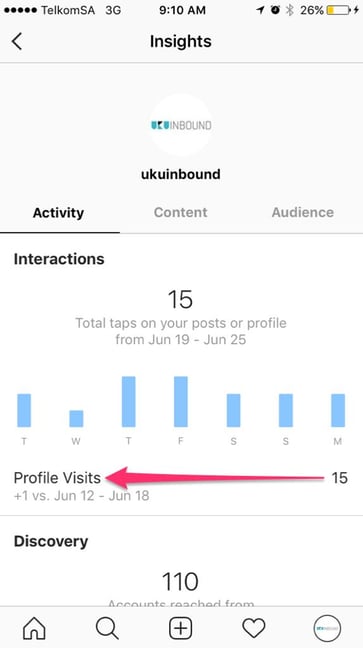
Profile views: The number of times your profile was viewed.
Website clicks: The number of times people have clicked through the link in your bio to get to your website.
Call or Email clicks: The number of click-throughs to call or email your business.
Posts: The number of Instagram posts you have published.
Mentions: The number of Instagram posts mentioning your Instagram handle.
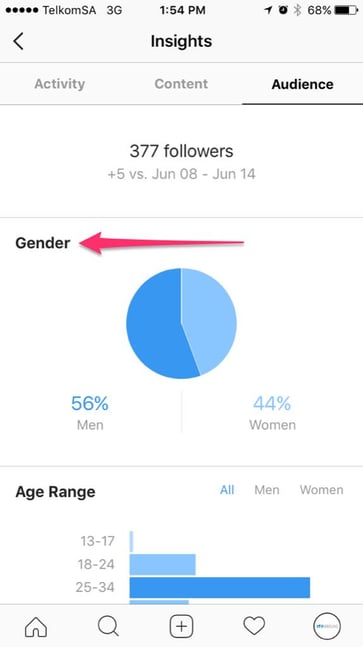
Instagram Audience Insights
Gender: The gender distribution of your followers (men or women).
Age: The age range distribution of your followers
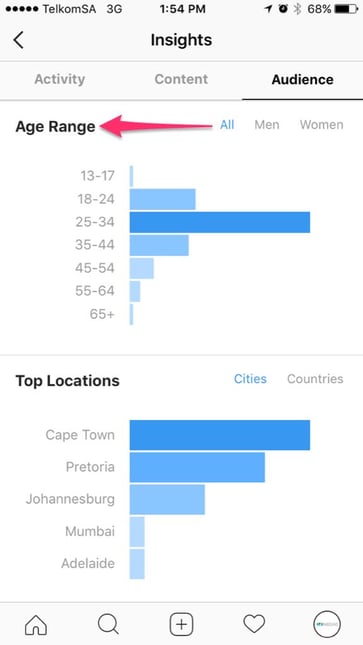
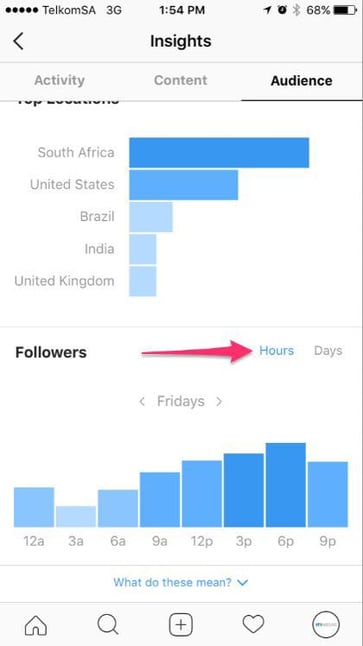
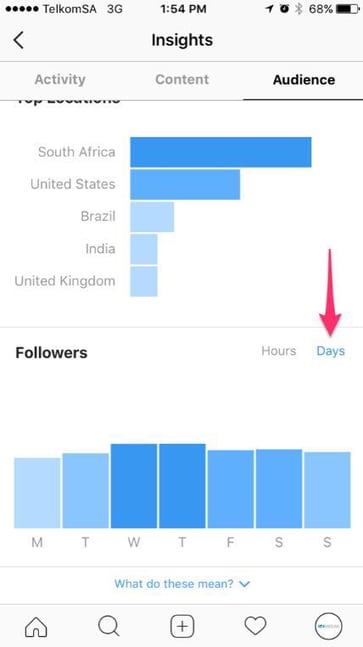
Top locations: The top five cities & countries where your followers are.
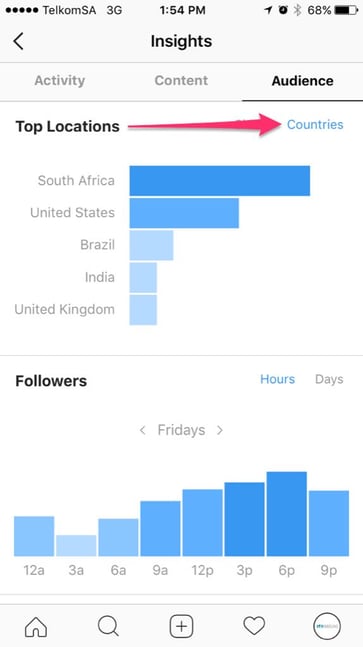
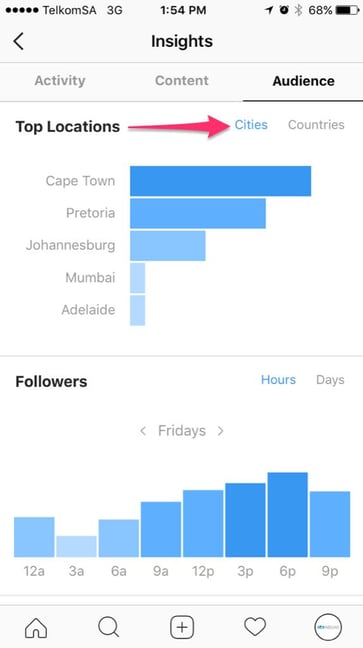
Followers – Hours: The average number of hours your followers are on Instagram on each day of the week.
Followers – Days: The days of the week when your followers are most active.
Instagram posts (Photos, videos and albums)
Likes: The number of unique accounts that liked a post.

Comments: The number of comments on a post.
Saved: The number of unique accounts that saved a post.
Engagement: The number of unique accounts that liked, saved, or commented on a post.
Views: The number of views of your video post, Instagram considers anyone who has watched your video for a minimum of 3 seconds as a view.

Instagram Stories
Exits: The number of times someone left your story either by leaving Stories or by swiping to see the next one..
Replies: The number of replies to a particular photo or video in your story.
People Insights: The list of accounts that have seen a particular photo or video in your story.
Instagram live videos
Live viewers at any given time: The number of accounts watching your live video and who they are.
Viewers: The number of accounts that saw any part of your Instagram live video.
IGTV
Views: The number of views of your video post, Instagram considered anyone who has watched your video for a minimum of 3 seconds as a view.
Likes: The number of unique accounts that liked a post.
Comments: The number of comments on a post.
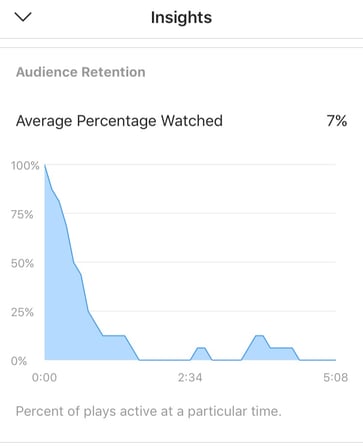
Average Percentage Watched: The percentage of your video watched. This is calculated as the percentage of your video watched as an average of all plays.
This also gives you a nice graph to show you the exact point where your viewers lose interest which is very helpful to determine the point where viewers lose interest and may help you do something else to keep their attention.
Instagram Analytics 2nd Level Metrics
Beyond the above-mentioned metrics that you can get with a fair bit of ease, some second level metrics require you to go one level deeper by using 1st level metrics to calculate more useful performance metrics so you can really crush it with your Instagram analytics.
2nd level metrics can generally be put into one of four different groups:
1. Growth
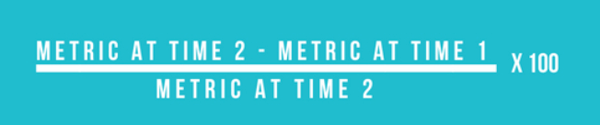
Growth metrics allow us to determine whether a certain metric has increased or decreased over time and the simple way to calculate that would be in the following manner:
Are you ready because this is quite a mouthful;
First you decide what growth you want to calculate then you would take the latest number and subtract the initial number from that, then you would divide the answer by the first number and then, stay with me now, multiply that by 100, this will give you a percentage to show how much your metric has either grown or declined by over a certain period or simply put;
Examples that can be calculated: Follower growth, impression growth, reach growth, engagement growth, clicks growth, and replies growth
2. Rate
When we calculate the rate, we want to measure one metric in comparison to another, for example;
The engagement rate would involve dividing the number of likes that a post received by the number of followers that you had at the time that the post was published;

Examples that can be calculated: Impression rate, engagement rate, view rate, click rate, exit rate, and completion rate.
3. Average
Average metrics give you a benchmark for the general performance of your Instagram posts.
For example; the metric, average likes per post, tells you generally the number of likes each of your posts received e.g;

4. Top Ranking Metrics
Although this is not really a metric that can be measured, it can still be very valuable to help you determine what sort of posts do very well and which do not resonate with your followers.
By ranking your posts by the number of impressions, reach, engagement, or views they received, you can find out which are your top performing posts and attempt to repeat the success.
Examples that can be ranked?
Your most liked posts, top videos, most commented on posts and top posts in terms of engagement.
Instagram Analytics Tools
There are many Instagram analytics apps and tools that you could use to collect and measure data for your Instagram efforts but I believe that it’s prudent and best to start with the free options, you can upgrade to paid service providers once you have mastered the free ones.
On that note, Instagram Insights is robust enough to provide you with all the data that you’ll need to grow your Instagram account.
What it all means and what to do about it:
The crux of everything we’ve discussed about Instagram analytics must lead us to make better decisions for both our brand and for our audiences.
The real magic begins to happen once you can take this data and turn it into insights which you can then feed back into your Instagram strategy
If you haven’t created an Instagram strategy yet, we have your back, read here to get started on creating a kick-ass one.
As a take away; there are usually two main areas that most people want to grow when it comes to Instagram, either more engagement or audience growth.
If you are aiming to gain more engagement, then you should focus on responding consistently to comments that are made in your posts, adding more CTA’s, either in your posts or in your captions, to get people to click through to your website and you should engage more with your top followers and their content.
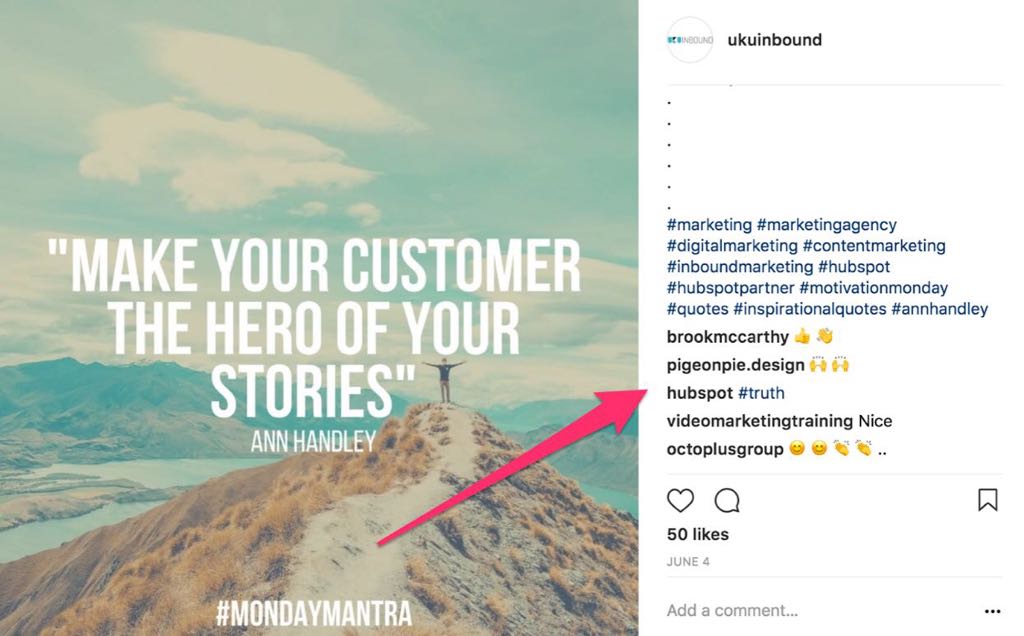
If you are aiming for audience growth, then you should focus on getting more exposure on your posts by adding the appropriate hashtags.
Growing your audience is a bit more tricky as you cannot determine at which point a person will decide that they like your content enough to follow you.
There are a few things that you can do to increase those odds such as using your Instagram analytics to see what your top posts are and attempting to recreate similar sorts of posts and by being cognisant of the days and hours when your audience is most active and timing your posts to coincide with these times.
Why don't you download our awesome 121 Digital Hacks Guide below. It’s awesome!